I was perusing the TMX site and checked on the Top TMX Short Position list that updates on the 15th and End of Month: https://www.tmxmoney.com/en/research/short_positions.html
As this is not something that I look at frequently my contextual read on it is hazy. However, it appears as if enormous short covering has been happening between April 30 and May 15 of 2017.
 |
| April 30 (Reflects April 17 - April 30) to May 15 |
Not sure what others may read from this as we don't have full info and timing, but here's what I see. Preceding the financial sell off was the Home Capital Group "debacle" that kicked off HCG's share price collapse around April 25. Again, I don't have short data for that period, but I'm guessing it has increased during that period for all financials.
April 30 to May 15 data shows the bear mauling? may have ended with a cover into weakness. TD and BNS short data shows that between April 17 (reflected as the period elapsed between the April 15 to April 30 update) and May 15 a major amount of shorts covered. Probably an expectation that the easy money has been made; at least for the time being depending on news flow.
Indeed as we went into the following week several events occurred.
* April 20 Ontario Wynne government unveiled more housing rules to cool down housing prices.
* April 27 Healthcare Of Ontario Pension Plan stepped in with the now infamous +20% interest $2 Billion line of credit. However, during this time things were very shaky as investors hung onto HCG's almost daily reports of deposit outflows. Fears of a housing collapse and HCG going for bankruptcy from their stealth bank run.
* May 9 HCG revealed a deal to sell $1.5 Billion in mortgages.
* May 10 some investors like CIBC and another Fund announced they have actually been increasing positions.
* May 12 reports were starting to show stabilization of HCG's deposits.
* May 24, Wednesday, the week after May 15, kicked off the Canadian bank earnings schedule.
I am interpreting this to mean the big boys that profited from the Canadian financials dropping got out of that trade in anticipation of improving HCG news flow and then bank earnings which could switch attention away onto more positives.
We will need to follow up with EoM May 31 data to see where things go, but I am guessing shorts continued covering as you will see in the June 2 share price.


- May 15: 49,464,727 (of 1,847,198,000 outstanding shares = 2.6778% of shares shorted. Not sure about derivative short positions.
- April 30: 61,783,555
- Net Change: -12,318,828
- % Change: -19.9386%
- April 17 (Period for the April 30 update): $66.20
- May 15 (Last Update): $63.67
- June 2 (Friday Close): $64.84
 |
| June 2 you can see the dip. |

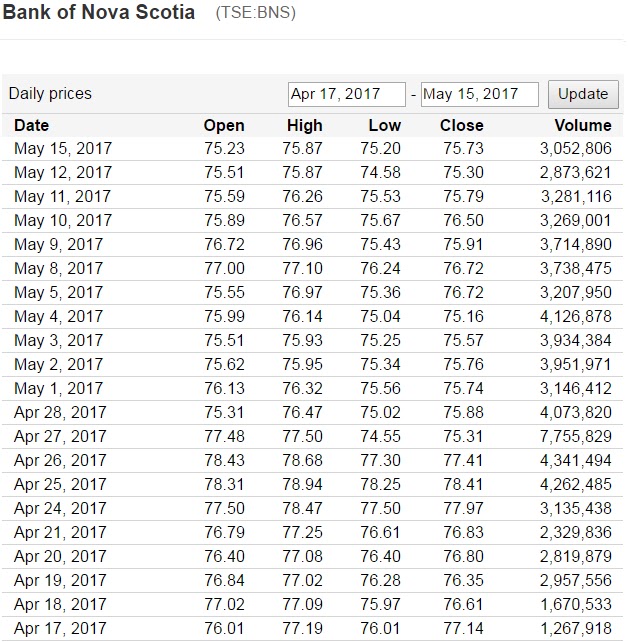
- May 15: 27,991,079 (of 1,201,865,000 outstanding shares = 2.3289% of shares shorted. Not sure about derivative short positions.)
- April 30: 34,550,102
- Net Change: -6,559,023
- % Change: -18.984%
- April 17 (Period for the April 30 update): $77.14
- May 15 (Last Update): $75.73
- June 2 (Friday Close): $76.68
 |
| June 2 you can see the dip. |
Of interest with the TSX 60 ETF shorts were covered and the price remained steady, unlike TD+BNS, which could indicate overall strength in the index. However, after May 15 the price was taken lower and again this may be news dependent. A global event of sorts as US Indicies went down alongside.
iShares S&P/TSX 60 Index Fund (XIU-TSX):
- May 15: 42,135,997
- April 30: 58,335,479
- Net Change: -16,199,482
- % Change: -27.7695%
- April 17 (Period for the April 30 update): $23.25
- May 15 (Last Update): $23.26
- June 2 (Friday Close): $22.84
