Saturday, June 3, 2017

TSX Top Short Positions Update (May 15 + April 30) $TD $BNS reductions.

I was perusing the TMX site and checked on the Top TMX Short Position list that updates on the 15th and End of Month: https://www.tmxmoney.com/en/research/short_positions.html

As this is not something that I look at frequently my contextual read on it is hazy. However, it appears as if enormous short covering has been happening between April 30 and May 15 of 2017.

April 30 (Reflects April 17 - April 30) to May 15

Not sure what others may read from this as we don't have full info and timing, but here's what I see. Preceding the financial sell off was the Home Capital Group "debacle" that kicked off HCG's share price collapse around April 25. Again, I don't have short data for that period, but I'm guessing it has increased during that period for all financials.

April 30 to May 15 data shows the bear mauling? may have ended with a cover into weakness. TD and BNS short data shows that between April 17 (reflected as the period elapsed between the April 15 to April 30 update) and May 15 a major amount of shorts covered. Probably an expectation that the easy money has been made; at least for the time being depending on news flow.

Indeed as we went into the following week several events occurred.

* April 20 Ontario Wynne government unveiled more housing rules to cool down housing prices.

* April 27 Healthcare Of Ontario Pension Plan stepped in with the now infamous +20% interest $2 Billion line of credit. However, during this time things were very shaky as investors hung onto HCG's almost daily reports of deposit outflows. Fears of a housing collapse and HCG going for bankruptcy from their stealth bank run.

* May 9 HCG revealed a deal to sell $1.5 Billion in mortgages.

* May 10 some investors like CIBC and another Fund announced they have actually been increasing positions.

* May 12 reports were starting to show stabilization of HCG's deposits.

* May 24, Wednesday, the week after May 15, kicked off the Canadian bank earnings schedule.

I am interpreting this to mean the big boys that profited from the Canadian financials dropping got out of that trade in anticipation of improving HCG news flow and then bank earnings which could switch attention away onto more positives.

We will need to follow up with EoM May 31 data to see where things go, but I am guessing shorts continued covering as you will see in the June 2 share price.


  • May 15: 49,464,727 (of 1,847,198,000 outstanding shares = 2.6778% of shares shorted. Not sure about derivative short positions.
  • April 30: 61,783,555
  • Net Change: -12,318,828
  • % Change: -19.9386%
  • April 17 (Period for the April 30 update): $66.20
  • May 15 (Last Update): $63.67
  • June 2 (Friday Close): $64.84

June 2 you can see the dip.


  • May 15: 27,991,079 (of 1,201,865,000 outstanding shares = 2.3289% of shares shorted. Not sure about derivative short positions.)
  • April 30: 34,550,102
  • Net Change: -6,559,023
  • % Change: -18.984%
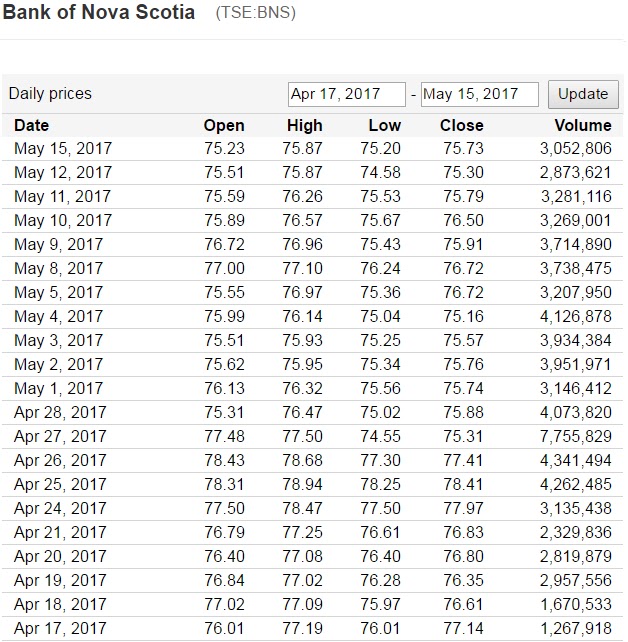
  • April 17 (Period for the April 30 update): $77.14
  • May 15 (Last Update): $75.73
  • June 2 (Friday Close): $76.68

June 2 you can see the dip.


Of interest with the TSX 60 ETF shorts were covered and the price remained steady, unlike TD+BNS, which could indicate overall strength in the index. However, after May 15 the price was taken lower and again this may be news dependent. A global event of sorts as US Indicies went down alongside.

iShares S&P/TSX 60 Index Fund (XIU-TSX):
  • May 15: 42,135,997
  • April 30: 58,335,479
  • Net Change: -16,199,482
  • % Change: -27.7695%
  • April 17 (Period for the April 30 update): $23.25
  • May 15 (Last Update): $23.26
  • June 2 (Friday Close): $22.84


Tuesday, May 30, 2017

$SVI.V StorageVault Canada Inc - Attended the Annual General Meeting (May 30, 2017)

My first Annual General Meeting (AGM) was several years ago for CML HealthCare (CLC). *Sigh* At least this time around it was for one of my big winners: StorageVault Canada Inc (TSX Venture Exchange: SVI). Admittedly, my knowledge of the self-storage industry is limited and maybe there's a superficial understanding of this self-storage company. My original interest and reasoning for buying SVI is because they are only Canadian publicly listed self-storage real estate company. There were good questions and answers at the AGM that helped bring some points together and gave me some additional understanding of the business.

I don't want to say this is advertising the stock, but by nature of posting these details it is inadvertently advertising a stock of mine and of which may be acquiring more. I will list out in point form what I picked up. Some numbers may not be accurate/misheard and the notes have not been reorganized to avoid potentially messing up the details.

Q: Who are the top players in Canada? (Answered by Steve)
- Main ones:
- StorageMart US company has 65 stores in Canada.
- Public Storage (Canada) 56 stores in Canada. Goal of building 1 and acquire 1 each year.
- Real Storage - Calgary, 31 stores. Used to be Mobile Home Manufacturer.
- Apple Self Storage 26 stores. Partnered with a US REIT.
- Maple Leaf Self Storage - Calgary/Vancouver. Family owned.

- No need to affiliate with US players.
- Also, REIT structure in the USA makes it harder for US REITs to own Canadian assets.

Q: $21 Million loss/Earnings per share loss? (Answered by Steve)
- These are accounting losses via depreciation.
- Storage business has a tax feature that allows for accelerated/increased depreciation, which quickly creates a tax shelter with Carry Forward Losses.
- When using shares to acquire a property IFRS accounting rule (#19?) applies. This registers the stock price difference between the acquisition announcement date vs the closure date. Example: $1.35 announce date vs $2.00 closure date. Record increased amount... ... ...  add Goodwill to balance sheet and increase write off. (Steve joked around a bit about accounting and also gave an example in the reverse if share price dropped instead of went up since announce/closure)

- Noted: Steve brought up $2.50 as an example number a couple times. Is this a theoretical issue price?

- Focus on Free Cash Flow / Funds From Operations

- Depreciation acceleration = increased tax shelter.

Q: How do you come up with the issue share price for the acquisitions? (Answered by Steve)
- Issuing shares "is a privilege, not a right."
- 3-4 month lag in deal closure due to approvals.
- No calculation. It is a deal by deal basis.
- Impact on purchase price due to tax considerations.
- Expect less use of stock and more use of cash <-- Due to increasing bargaining power.
- 20 years in storage business. Problem with acquirees is they are savvy and their accountants tell them of tax implications + Estate & Tax Planning.
- Distribution - they prefer to reinvest into company, but acquirees' tax plan/retire want cashflow.

- NOI increase 4-6%? tgt 6-10%? ???

- US vs Canada saturation: CBRE report currently 2.2 to 2.5 sq ft per capita. Typical is 4? sq ft per capita.
- Room for more, but tough to build in Canada.

- 85% of customers are within 5km radius. Supply not meeting demand.
- Population driven business.

- 2,500 to 3,000 stores in Canada? SVI 84-86 stores + Access Storage 50 stores = ~140 stores
- Largest 10 have 12%
- Attractive business due to: High Margin, 0 Bad Debt, and Low employee.

Q: How much is spent to acquire each customer? (Answered by Steve)
- Spend per customer: $70-80
- New customers cost more.
- Discounts, advertising, referrals, advertising signs, local events, Google.
- GOOG = 50-60% of spend "Google-flation"
- Customers usually expect to use services for 3-4 months. Usually 11 months? Their customers stay for 16 months?
- People also rarely visit their units.

- PODs business competes with moving companies (DIY).
- September 2016 became a "Vendor Member of Costco" meaning exclusive supplier of storage services for Costco members.
- Excess land allows them to store PODs.
- Biggest cost of PODs = land for storage with SVI.
- However, 50% of POD users end up storing it at home.

- Redevelopment/rezoning opportunities?
- 750,000 sq ft of expansion opportunity.
- BC expansion coming online... ? 40K
- Montreal 10K expansion in summer.
- Target 50k build out per year that is demand driven.

Q: How do you get your information? (Answered by Steve)
- Canadian Self Storage Association + US large owners group
- Bought stuff via "direct drive" they have never bought anything listed.
- (Info asymmetry = benefit them)
- Fill funnel for 10-15 years? (Does this mean they want to have a list of acquisitions for that period of time?)

Q: Debt maturities? (Answered by Iqbal)
- Renewals this year, some.
- Maturity over 5 years.
- Good reception from lenders for refinance.
- Major lenders are in this industry now compared to decades? ago.
- Default rate close to 0% industry-wide
- 2021-2022? staggered debt maturities

Tuesday, March 28, 2017

The 2K Club Is Now Open: $ENF Enbridge Income Fund Holdings Inc

Enbridge Income Fund Holdings Inc and Enbridge Inc released a $500,000,000 secondary share offering today at $33.15 a 3.5% discount to the previous day's trade of $34.51. At $33.15 ENF has a yield to cost of 6.193%. The offer closes April 18, 2017.

http://www.marketwired.com/press-release/enbridge-income-fund-holdings-inc-announces-05-billion-secondary-offering-common-shares-tsx-enf-2205637.htm

My portfolio already has a significant number of ENF shares 800 @ $30.3604 with a yield to cost of 6.7627%. The position provides a total yearly income of $1,642.56.

The price drop presented a compelling opportunity and led to a decision to overload my position though picking up 300 more shares at $33.29. Effectively, my share count is now 1,100 @ $31.1693 with a lower yield to cost of 6.5872%. However, the new position now provides a higher yearly income of $2,258.52.

Welcome to The 2K Club.

I will need to monitor as this add-on as it is completely funded with debt at 3.45%. The dividend covers the interest payments nicely plus some of the principle. If the shares increase enough then it will be an opportunity to lighten up. Utilising investment debt is a add-on strategy to my original dividend portfolio goal. My portfolio will forego Dividend Reinvestment and replace it with earlier and larger share purchases with the cash flow paying off the debts.

We're nearing the end of March and I will start working on my 50K Report for Q1 FY2017. Since Q4 FY2016 there have been interesting developments bringing me ever-so-slightly closer to the 50K goal.

Thursday, February 2, 2017

$BCE Q4 F2016: "dividend since the end of 2008 – a total increase of 97%"

BCE released their Q4 F2016 earnings today and rewarded shareholders with a +$0.14, +5.128% dividend increase from $2.73 to $2.87.
BCE common share dividend increasedToday's dividend announcement is BCE's 13th increase to its annual common share dividend since Q4 2008, representing a 97% increase. The BCE annualized common share dividend will increase 5.1%, or 14 cents per share, from $2.73 to $2.87 effective with BCE's Q1 2017 dividend payable on April 15, 2017 to shareholders of record at the close of business on March 15, 2017. This is BCE's 9th consecutive year of 5% or better dividend growth, while maintaining the dividend payout ratio(3) within the target policy range of 65% to 75% of free cash flow. The higher dividend for 2017 is fully supported by projected growth in free cash flow.
http://www.bce.ca/news-and-media/releases/show/BCE-reports-2016-Q4-and-full-year-results-announces-2017-financial-targets-Common-share-dividend-increased-5-1-to-2-87-per-year-1?page=1&month=&year=
Wow, since Q4 2008 the dividend increased by 97%! In hindsight, BCE continues to be a dividend machine. I decided to pull some numbers to see what this means for long term dividend investors.

The Q4 2008 dividend was declared on December 12, 2008 payable January 15, 2009 at $0.365/share, annualized $1.46. Let's take the closing price on the declaration date: $21.23. This means BCE offered a yield of 6.877%.

Taking the Q1 2017 dividend of $0.7175/share annualized to $2.87. We're looking at a yield to cost of 13.518%. That's a 13.518% cash-in-hand return per year without having to trade and without having to worry about price fluctuations.

Looking at it in another way; I took all the dividend payments since Q4 2008 until Q1 2017. One share of BCE at $21.23 was yielding 6.8771% and paid out $0.365 in Q4 2008. By the upcoming Q1 2017 that one share would yield 13.5186%, an increase, as BCE stated of 96.5741%.

Taking it even further, the chart at end of my post below shows how one share would have returned $18.8425 in cash, an 88.75% cash-in-hand return on the original principle of $21.23. This doesn't include the capital appreciation. Adding share price gains today's close was $57.44, a +$36.21 or 170.5605% share appreciation. Putting dividend and share appreciation together we hit 259.3146% returns. Not bad at all.

There are many other dividend stocks out there that have provided lucrative and passive returns. The risk is always there of share price declines due to a negative shift in the business and dividends are not guaranteed. With hindsight we can say BCE so far has been a successful dividend play.

Total Dividend $18.84250
Share Price $21.23000
Cash Return 88.75%

Dividend + Share Appreciation = $55.0525
Total Return = 259.3146%

There

Declaration Date Record Date Payment Date Dividend Annual Dividend Share Price Yield to Cost
2008-12-12 2008-12-23 2009-01-15 $0.36500 $1.46000 $21.23 6.8771%
2009-02-10 2009-03-16 2009-04-15 $0.38500 $1.54000 $21.23 7.2539%
2009-05-06 2009-06-15 2009-07-15 $0.38500 $1.54000 $21.23 7.2539%
2009-08-05 2009-09-15 2009-10-15 $0.40500 $1.62000 $21.23 7.6307%
2009-11-11 2009-12-15 2010-01-15 $0.40500 $1.62000 $21.23 7.6307%
2010-02-03 2010-03-15 2010-04-15 $0.43500 $1.74000 $21.23 8.1959%
2010-05-05 2010-06-15 2010-07-15 $0.43500 $1.74000 $21.23 8.1959%
2010-08-04 2010-09-15 2010-10-15 $0.45750 $1.83000 $21.23 8.6199%
2010-12-09 2010-12-15 2011-01-15 $0.45750 $1.83000 $21.23 8.6199%
2011-02-09 2011-03-15 2011-04-15 $0.49250 $1.97000 $21.23 9.2793%
2011-05-11 2011-06-15 2011-07-15 $0.51750 $2.07000 $21.23 9.7504%
2011-08-03 2011-09-15 2011-10-15 $0.51750 $2.07000 $21.23 9.7504%
2011-11-02 2011-12-15 2012-01-15 $0.51750 $2.07000 $21.23 9.7504%
2012-02-08 2012-03-15 2012-04-15 $0.54250 $2.17000 $21.23 10.2214%
2012-05-03 2012-06-15 2012-07-15 $0.54250 $2.17000 $21.23 10.2214%
2012-08-07 2012-09-14 2012-10-15 $0.56750 $2.27000 $21.23 10.6924%
2012-10-31 2012-12-14 2013-01-15 $0.56750 $2.27000 $21.23 10.6924%
2013-02-06 2013-03-15 2013-04-15 $0.58250 $2.33000 $21.23 10.9750%
2013-05-08 2013-06-14 2013-07-15 $0.58250 $2.33000 $21.23 10.9750%
2013-08-07 2013-09-16 2013-10-15 $0.58250 $2.33000 $21.23 10.9750%
2013-11-06 2013-12-16 2014-01-15 $0.58250 $2.33000 $21.23 10.9750%
2014-02-05 2014-03-14 2014-04-15 $0.61750 $2.47000 $21.23 11.6345%
2014-05-05 2014-06-16 2014-07-15 $0.61750 $2.47000 $21.23 11.6345%
2014-08-06 2014-09-15 2014-10-15 $0.61750 $2.47000 $21.23 11.6345%
2014-11-05 2014-12-15 2015-01-15 $0.61750 $2.47000 $21.23 11.6345%
2015-02-04 2015-03-16 2015-04-15 $0.65000 $2.60000 $21.23 12.2468%
2015-04-29 2015-06-15 2015-07-15 $0.65000 $2.60000 $21.23 12.2468%
2015-08-05 2015-09-15 2015-10-15 $0.65000 $2.60000 $21.23 12.2468%
2015-11-04 2015-12-15 2016-01-15 $0.65000 $2.60000 $21.23 12.2468%
2016-02-03 2016-03-15 2016-04-15 $0.68250 $2.73000 $21.23 12.8592%
2016-04-27 2016-06-15 2016-07-15 $0.68250 $2.73000 $21.23 12.8592%
2016-08-03 2016-09-15 2016-10-15 $0.68250 $2.73000 $21.23 12.8592%
2016-11-02 2016-12-15 2017-01-15 $0.68250 $2.73000 $21.23 12.8592%
2017-02-01 2017-03-15 2017-04-15 $0.71750 $2.87000 $21.23 13.5186%